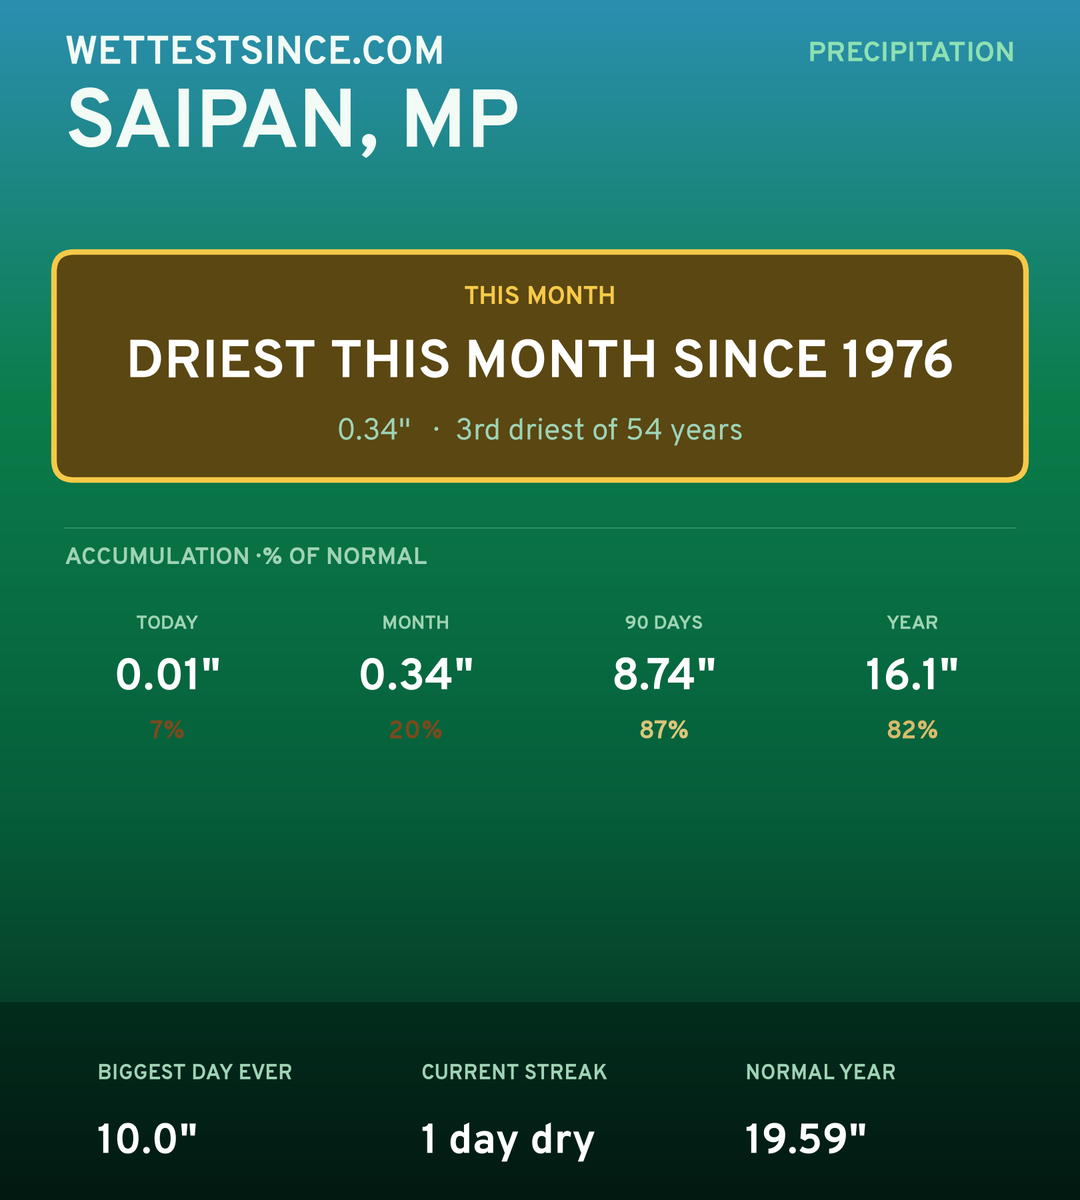
current run under 0.01" · longest ever 19 days (to May 23, 2005)
Wet Streak
4days
consecutive days with rain · longest ever 78 days
Year to Date vs Normal
73%
26.01" of a normal 35.41" · wettest 60.98" (2004) · driest 9.06" (1966)
Wettest & Driest Years
The extremes of a 45-year record (1947–2023) — full calendar-year totals. The long-run average is 68.11" a year.
Wettest Years on Record
1
2004
104.19in
2
2023
91.13in
3
2019
88.06in
4
2015
86.13in
5
1989
83.66in
Driest Years on Record
1
1998
34.09in
2
1947
47.56in
3
1973
48.09in
4
1949
49.94in
5
1969
50.13in
Rainfall by Month
The seasonal rhythm — each month's normal precipitation, with this year's totals in blue. Where the blue bar clears the band, the month ran wetter than usual.
J
F
M
A
M
J
J
A
S
O
N
D
Normal (median)This year
Normally wettest in Aug (~10.08") and driest in Mar (~1.98"). Wettest calendar month ever: Aug 2004, 34.15".
This Day in History · Rainfall
Every year's rainfall on each of the next 7 dates at Saipan — toggle a day below. The tallest bar (ringed) is the wettest on record for that date.
Wettest Aug 24 ever
5.20in
set in 2004
Rain on Aug 24
69%
of 58 years had measurable rain
Wettest Aug 25 ever
2.38in
set in 1993
Rain on Aug 25
82%
of 56 years had measurable rain
Wettest Aug 26 ever
2.06in
set in 1955
Rain on Aug 26
77%
of 57 years had measurable rain
Wettest Aug 27 ever
2.00in
set in 2001
Rain on Aug 27
86%
of 57 years had measurable rain
Wettest Aug 28 ever
4.31in
set in 1957
Rain on Aug 28
74%
of 57 years had measurable rain
Wettest Aug 29 ever
4.94in
set in 2002
Rain on Aug 29
77%
of 57 years had measurable rain
Wettest Aug 30 ever
2.88in
set in 2023
Rain on Aug 30
84%
of 57 years had measurable rain
This Year's Rainfall
Saipan's cumulative rainfall so far this year against its own record — the normal accumulation, and the wettest & driest years to date. The bright line is the running total; where it rides the band tells the story at a glance.
Saipan's entire daily record as one heatmap — each row a year, each cell a day, shaded by that day's rainfall. Dry spells read as dark blocks, wet seasons as brighter bands; the whole climate at a glance.